2025 Smart & Healthy Buildings Workshop
Introduction
The Fall 2025 iteration of Smart and Healthy Buildings culminates in eight student groups researching what the future of smart and healthy buildings should look like. The projects improve how we analyze data from buildings, show us how we can integrate AI better into future building-focused systems, and help resolve real-world problems with maintaining our buildings.
Time and Location
- Date: Friday, December 12, 2025
- Time: 2:00PM - 5:00PM
- Location: Rice 340
Schedule
| Time | Paper |
|---|---|
| Session 1: Indoor Conditions | |
| 2:05-2:15 | Effects of Meeting Type on Indoor Environmental Conditions in Shared Spaces |
| 2:17-2:27 | Creating a Visual Interface to Display Indoor Conditions |
| 2:30-2:40 | Adaptive Noise Masking in Indoor Environments |
| 2:40-3:00 | Panel 1 |
| Break | |
| Session 2: Finding Failures | |
| 3:10-3:20 | Follow the Schema: Finding the Valve Before the Flood |
| 3:22-3:32 | Physics-Informed Detection of Faulty Sensors in Smart Buildings |
| 3:32-3:50 | Panel 2 |
| Break | |
| Session 3: Do the Analysis | |
| 4:00-4:10 | Use LLM to Analyze Sensor Data Stream |
| 4:12-4:22 | Spatial Energy Visualization and Nighttime Anomaly Detection for the University of Virginia’s Living Link Lab |
| 4:25-4:35 | AI Generated Building Summary: From Sensor Data to Daily Report |
| 4:35-4:55 | Panel 3 |
Papers
Spatial Energy Visualization and Nighttime Anomaly Detection for the University of Virginia’s Living Link Lab
Authors: Seth Chase, Taran Gupta, Natalie Bretton, Abigail Corish,
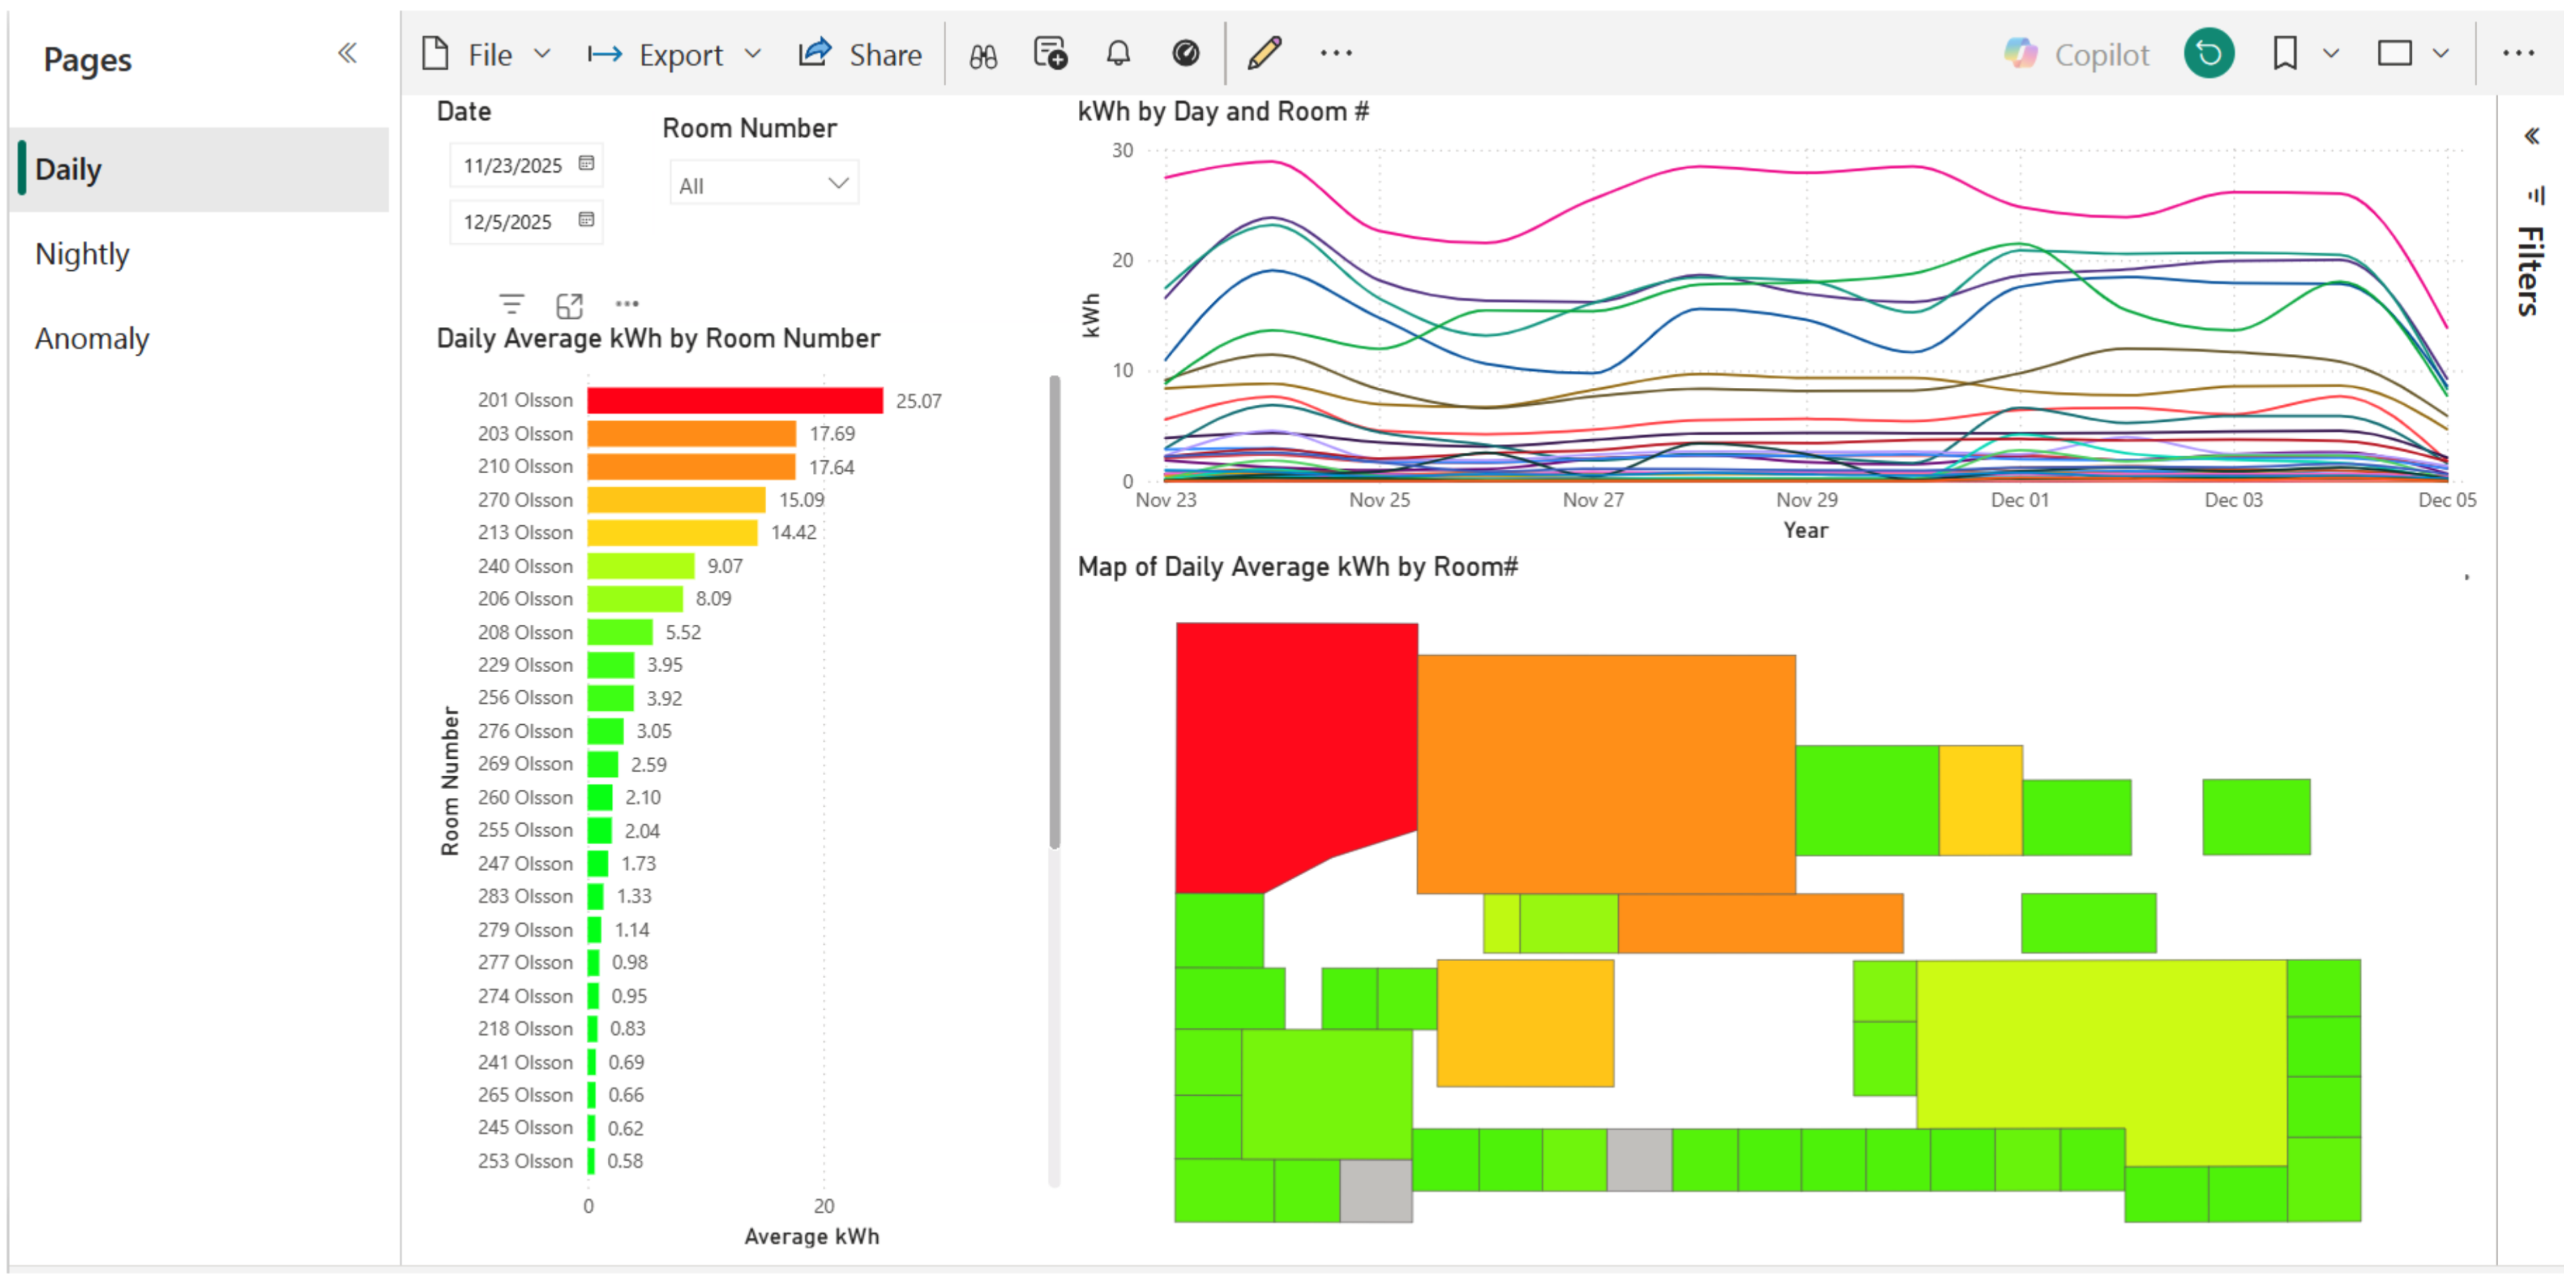 In order to precisely characterize building power usage, sensors sample data multiple
times per minute; however, this results in large, complex datasets that make
meaningful insights hard to extract. An interactive, color-coded map of power usage
provides an intuitive summary of how power usage varies both room by room and
through time. This maintains data integrity while increasing usability. Data was first
analyzed using Python, and then exported to Power BI to create visualizations that can
be easily accessed. A room occupant can then use this output to see how their power
usage compares to that of their neighbors or if a device has been left on overnight. It
can be utilized by a building manager to find potential locations of energy latency,
allowing them to make relevant adjustments, reducing power usage and costs.
In order to precisely characterize building power usage, sensors sample data multiple
times per minute; however, this results in large, complex datasets that make
meaningful insights hard to extract. An interactive, color-coded map of power usage
provides an intuitive summary of how power usage varies both room by room and
through time. This maintains data integrity while increasing usability. Data was first
analyzed using Python, and then exported to Power BI to create visualizations that can
be easily accessed. A room occupant can then use this output to see how their power
usage compares to that of their neighbors or if a device has been left on overnight. It
can be utilized by a building manager to find potential locations of energy latency,
allowing them to make relevant adjustments, reducing power usage and costs.
AI Generated Building Summary: From Sensor Data to Daily Report
Authors: Samriddhi Kumar, Jack Hauger, Kushan Dixit, Evin St Clair, Benjamin Oppong
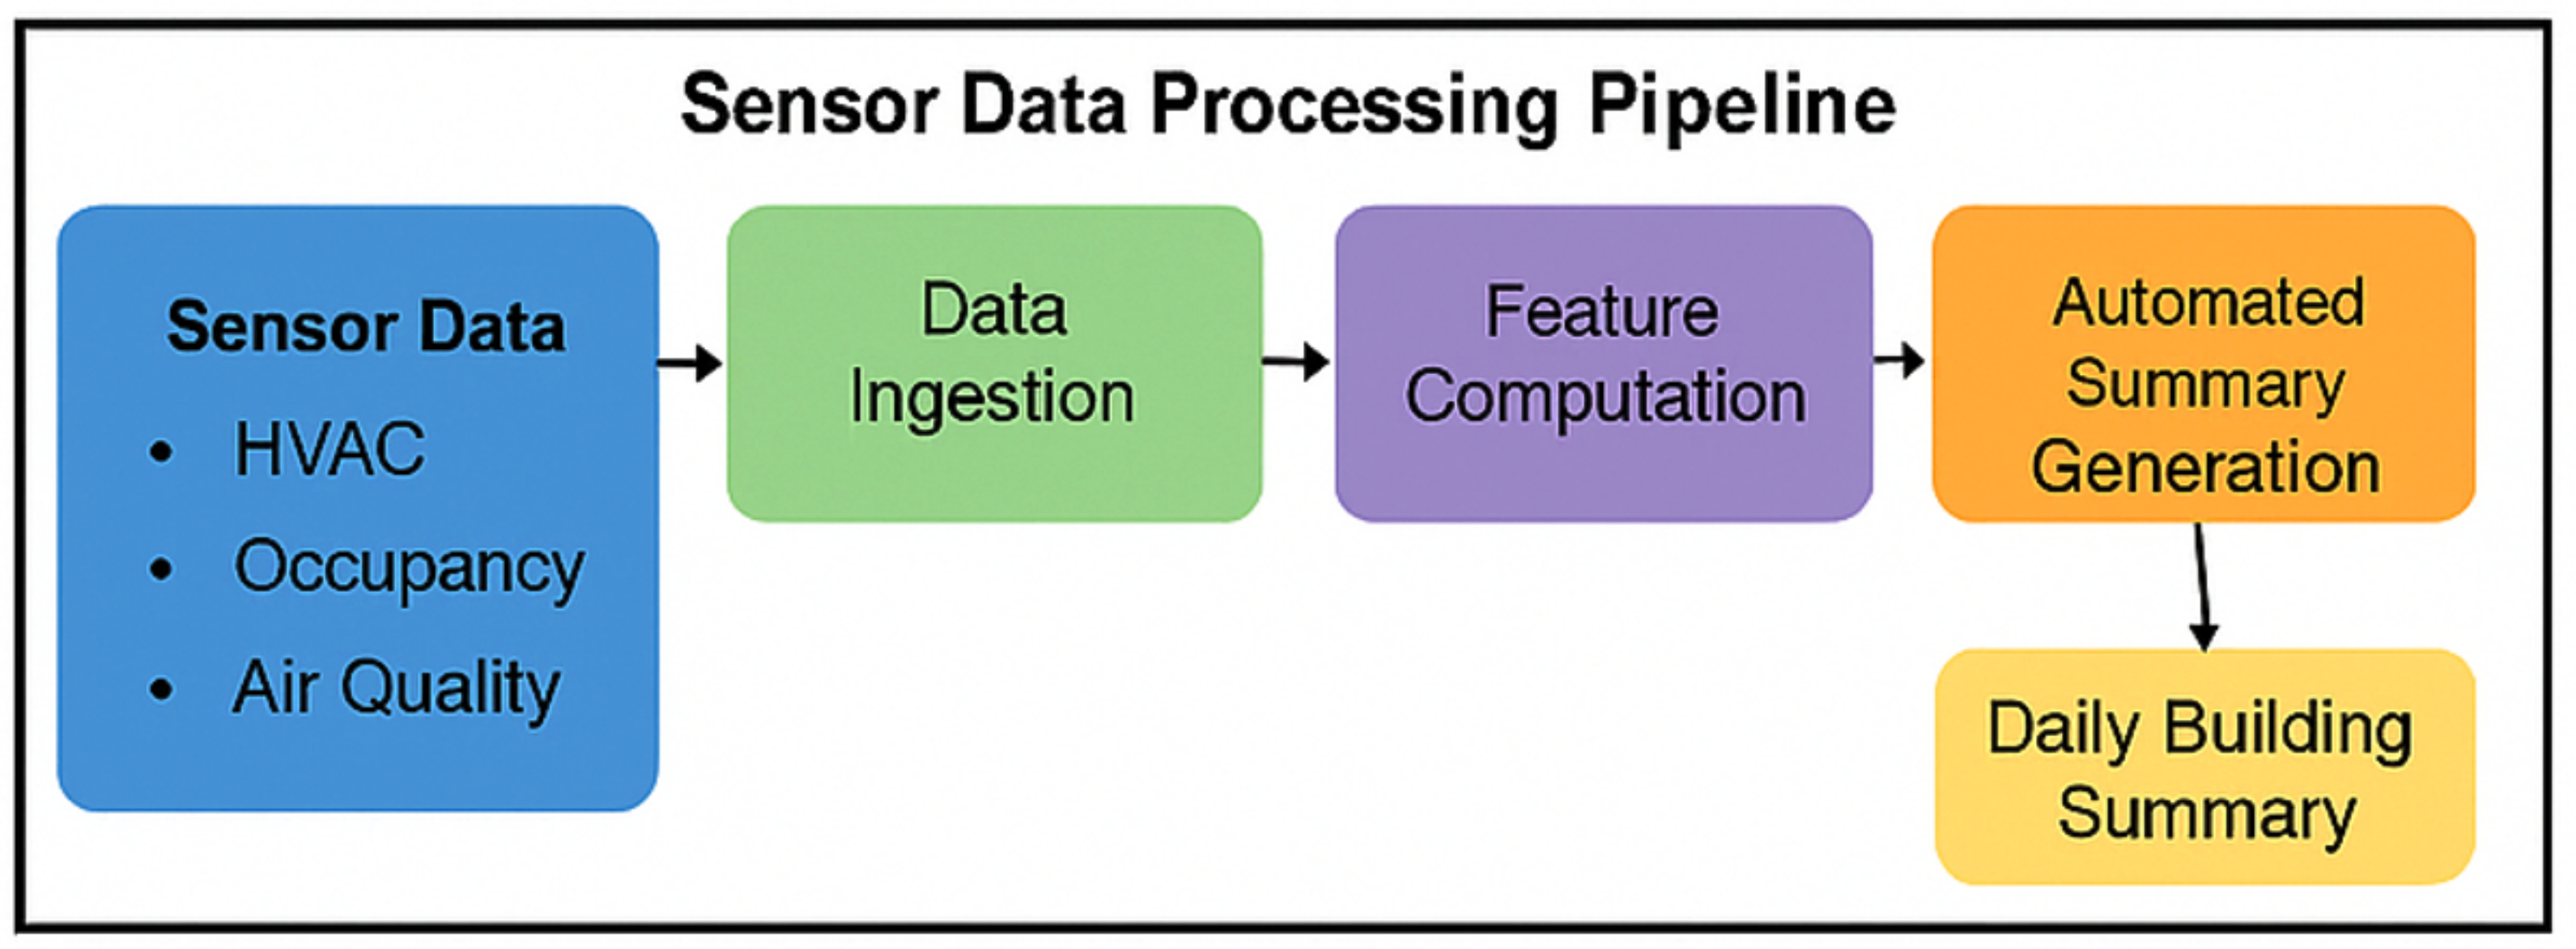 Our project develops an AI‑powered Smart Building Intelligence System that
automatically processes real sensor data streams—such as temperature, CO₂, VOCs,
occupancy, and environmental metrics—to generate daily operational summaries for
facility managers. The system ingests raw building data, computes performance features,
detects potential anomalies, and uses a large language model to produce clear, actionable
reports. This enables faster decision‑making, enhances occupant comfort and safety, and
modernizes building management workflows through automated intelligence.
Our project develops an AI‑powered Smart Building Intelligence System that
automatically processes real sensor data streams—such as temperature, CO₂, VOCs,
occupancy, and environmental metrics—to generate daily operational summaries for
facility managers. The system ingests raw building data, computes performance features,
detects potential anomalies, and uses a large language model to produce clear, actionable
reports. This enables faster decision‑making, enhances occupant comfort and safety, and
modernizes building management workflows through automated intelligence.
Creating a Visual Interface to Display Indoor Conditions
Authors: Kayla Sprincis, Logan Brock, Xiling Meng, Danielle Sydow
 Modern building sensors can provide valuable information regarding occupants’ health, comfort, and
safety. However, the scale and complexity of collected time-series data often make the data’s real-world
implications inaccessible to non-technical users. This paper presents a visual interface designed to
translate real-time sensor measurements for six key building metrics – temperature, carbon dioxide,
volatile organic compounds, humidity, noise, and illumination – into a digitally displayed, intuitive
color-coded diagram. The system combines simple time-series analytics with a large language model
(LLM), which interprets sensor readings, trends, and predefined health-related thresholds to select
representative hexadecimal colors. A Streamlit web application displays the model’s outputs in a dynamic
packed bubble chart, which adapts to emphasize the most critical metric levels at any given time. Tests for
consistency demonstrate that the LLM’s color assignments remain stable for identical metric inputs and
vary appropriately across distinct environmental conditions. The resulting interface streamlines
interpretation of indoor conditions, rendering building data more accessible to technical and non-technical
audiences alike. This work showcases the capacity of AI-assisted visualization to generalize IoT data,
while highlighting future opportunities to improve accessibility, interpretability, and reliability through
user studies and refined prompt engineering.
Modern building sensors can provide valuable information regarding occupants’ health, comfort, and
safety. However, the scale and complexity of collected time-series data often make the data’s real-world
implications inaccessible to non-technical users. This paper presents a visual interface designed to
translate real-time sensor measurements for six key building metrics – temperature, carbon dioxide,
volatile organic compounds, humidity, noise, and illumination – into a digitally displayed, intuitive
color-coded diagram. The system combines simple time-series analytics with a large language model
(LLM), which interprets sensor readings, trends, and predefined health-related thresholds to select
representative hexadecimal colors. A Streamlit web application displays the model’s outputs in a dynamic
packed bubble chart, which adapts to emphasize the most critical metric levels at any given time. Tests for
consistency demonstrate that the LLM’s color assignments remain stable for identical metric inputs and
vary appropriately across distinct environmental conditions. The resulting interface streamlines
interpretation of indoor conditions, rendering building data more accessible to technical and non-technical
audiences alike. This work showcases the capacity of AI-assisted visualization to generalize IoT data,
while highlighting future opportunities to improve accessibility, interpretability, and reliability through
user studies and refined prompt engineering.
Use LLM to Analyze Sensor Data Stream
Authors: Wenhao Xu, Sonia Birate, Chenxu Li, Zeyang Zheng
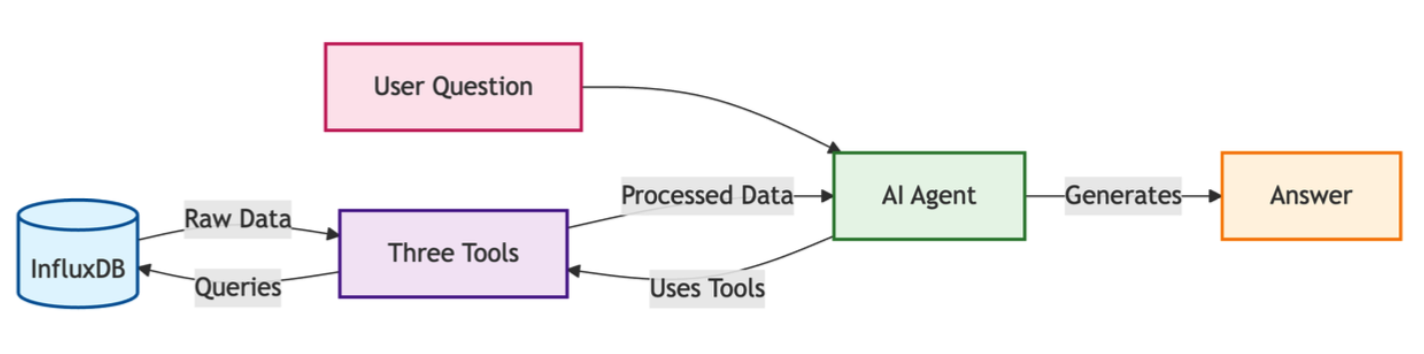 Our project explores whether a Large Language Model (LLM) can interpret continuous sensor
data streams and translate them into meaningful, human-readable insights. Modern buildings
collect massive amounts of data from sensors like power, air quality, and lighting, yet these
readings are often difficult to understand without expert analysis. We developed a Facility
Manager ReAct Agent that retrieves real power-consumption data from InfluxDB, analyzes
trends, computes statistics, and infers potential real-world activities occurring inside a room. By
combining LLM reasoning with targeted tool calls, our system achieves 100% accuracy on
numerical queries and reliably segments activity periods based on raw sensor patterns. This
work demonstrates the feasibility of using LLMs as a semantic layer for building-health
monitoring, reducing reliance on static rules and enabling smarter, context-aware environments.
Our project explores whether a Large Language Model (LLM) can interpret continuous sensor
data streams and translate them into meaningful, human-readable insights. Modern buildings
collect massive amounts of data from sensors like power, air quality, and lighting, yet these
readings are often difficult to understand without expert analysis. We developed a Facility
Manager ReAct Agent that retrieves real power-consumption data from InfluxDB, analyzes
trends, computes statistics, and infers potential real-world activities occurring inside a room. By
combining LLM reasoning with targeted tool calls, our system achieves 100% accuracy on
numerical queries and reliably segments activity periods based on raw sensor patterns. This
work demonstrates the feasibility of using LLMs as a semantic layer for building-health
monitoring, reducing reliance on static rules and enabling smarter, context-aware environments.
Effects of Meeting Type on Indoor Environmental Conditions in Shared Spaces
Authors: Drake Ferri, Grace Fry, Matt Juntima, Joe Moran, Robel Woldegyorgis
 Meetings are a major driver of occupancy in shared indoor spaces, yet little is
known about how different meeting types contribute to short-term changes in
indoor air quality (IAQ). This study analyzed environmental sensor data linked
with 10,255 validated meetings held in the University of Virginia’s Living Link
Lab from 2018–2025. A rule-based classifier assigned meetings to six
categories: Admin/Leadership/Programs, Events/Outreach/Social,
Instruction/Student Support, Research/Lab/Project, Walkup, and Other.
Nonparametric statistical tests were used to evaluate differences in peak
changes of CO₂ and volatile organic compounds (VOCs) relative to pre-meeting
baselines. Results showed statistically significant but generally small
differences in peak CO₂ increases across categories, with substantial overlap
in distributions. VOC responses showed clearer differentiation.
Instruction/Student Support and Events/Outreach/Social meetings tended to
produce larger VOC peaks, whereas Walkup and Research/Lab/Project meetings
showed smaller changes. These patterns indicate that meeting type provides
meaningful structure for describing IAQ variability, particularly for VOCs, but
explains only a portion of the overall variation. Overall, meeting type
information may serve as a useful input for IAQ-aware building management,
although practical control strategies will require integrating meeting
classification with occupancy, ventilation conditions, and room
characteristics. This study provides an empirical foundation for future work on
IAQ-driven scheduling and ventilation planning in shared indoor environments.
Meetings are a major driver of occupancy in shared indoor spaces, yet little is
known about how different meeting types contribute to short-term changes in
indoor air quality (IAQ). This study analyzed environmental sensor data linked
with 10,255 validated meetings held in the University of Virginia’s Living Link
Lab from 2018–2025. A rule-based classifier assigned meetings to six
categories: Admin/Leadership/Programs, Events/Outreach/Social,
Instruction/Student Support, Research/Lab/Project, Walkup, and Other.
Nonparametric statistical tests were used to evaluate differences in peak
changes of CO₂ and volatile organic compounds (VOCs) relative to pre-meeting
baselines. Results showed statistically significant but generally small
differences in peak CO₂ increases across categories, with substantial overlap
in distributions. VOC responses showed clearer differentiation.
Instruction/Student Support and Events/Outreach/Social meetings tended to
produce larger VOC peaks, whereas Walkup and Research/Lab/Project meetings
showed smaller changes. These patterns indicate that meeting type provides
meaningful structure for describing IAQ variability, particularly for VOCs, but
explains only a portion of the overall variation. Overall, meeting type
information may serve as a useful input for IAQ-aware building management,
although practical control strategies will require integrating meeting
classification with occupancy, ventilation conditions, and room
characteristics. This study provides an empirical foundation for future work on
IAQ-driven scheduling and ventilation planning in shared indoor environments.
Follow the Schema: Finding the Valve Before the Flood
Authors: Sriya Gandikota, Shaina Kumar, Nester Phiri, Navian Francis
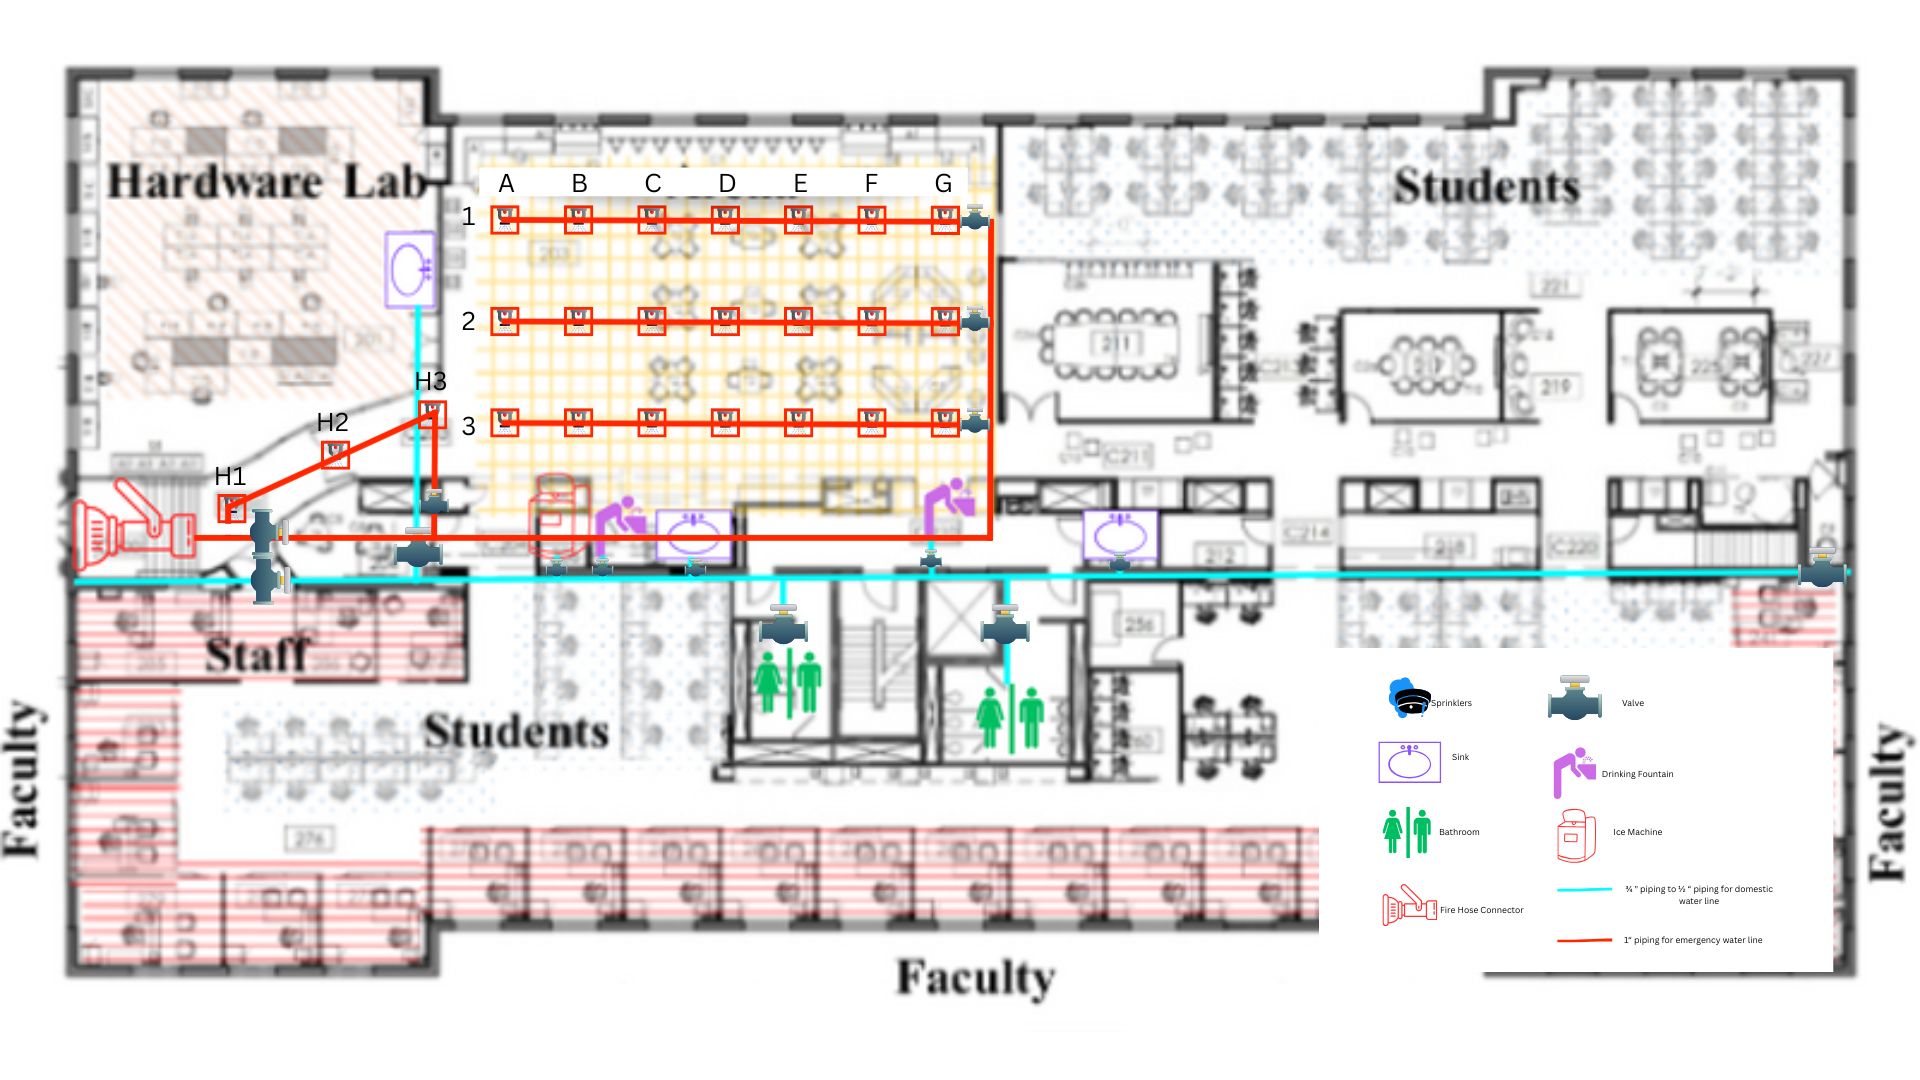 Buildings are increasingly integrating cyber-physical systems within buildings. This paper
examines the use of the Brick schema, a standardized metadata framework, to identify and
localize valves during leak scenarios. The Brick schema is based on a mapping of valves,
pipe segments, fixtures, and flow relationships across a building, independent of existing
asset systems. The schema can be extended with domain-specific metadata and paired
with a reasoning engine to provide actionable guidance for emergency response and
maintenance workflows. The results from multiple test cases validate the schema’s
alignment with Brick/UVA conventions and demonstrate its capacity to balance
containment eFiciency with operational continuity. The model can identify optimal valves
for leak isolation and quantify room-level service outages underscores its potential to
enhance emergency response, maintenance planning, and overall building resilience. The
system transforms static building information into actionable insights, laying the
foundation for more scalable, intelligent infrastructure management tools.
Buildings are increasingly integrating cyber-physical systems within buildings. This paper
examines the use of the Brick schema, a standardized metadata framework, to identify and
localize valves during leak scenarios. The Brick schema is based on a mapping of valves,
pipe segments, fixtures, and flow relationships across a building, independent of existing
asset systems. The schema can be extended with domain-specific metadata and paired
with a reasoning engine to provide actionable guidance for emergency response and
maintenance workflows. The results from multiple test cases validate the schema’s
alignment with Brick/UVA conventions and demonstrate its capacity to balance
containment eFiciency with operational continuity. The model can identify optimal valves
for leak isolation and quantify room-level service outages underscores its potential to
enhance emergency response, maintenance planning, and overall building resilience. The
system transforms static building information into actionable insights, laying the
foundation for more scalable, intelligent infrastructure management tools.
Adaptive Noise Masking of Construction in Indoor Environments
Authors: Nyla Gordon-Crocker, Ian Straits, Greg Zeckman, Bhavya Boddu
 Construction noise has become a persistent challenge for indoor work environments, particularly on busy
campuses, where working amidst constant construction has become the norm. Investigation has shown that
acoustic comfort is important to maintaining occupant health, concentration, and productivity. This study
proposes a reactive noise processing model that utilizes machine learning to classify construction noise from
recorded audio, thereby informing a conceptual white noise generator to mask and mitigate acoustic
disturbances. A 24-hour waveform audio was collected from a personal office in Olsson Hall at the University
of Virginia, with close proximity to the VERVE construction site. The audio was divided into 10-second
chunks, with 1,619 manually labeled as either 1 (not containing construction) or 0 (containing construction).
The manual data set was used to train a random forest classifier in an 80/20 train-test split, utilizing extracted
acoustic features from Librosa, a Python-based audio processing software. The model correctly labeled 82% of
audio chunks, proving the ability to identify construction noise amidst other sounds present in an academic
space. Applying the classifier to the remaining 8,646 chunks revealed that construction activity clustered
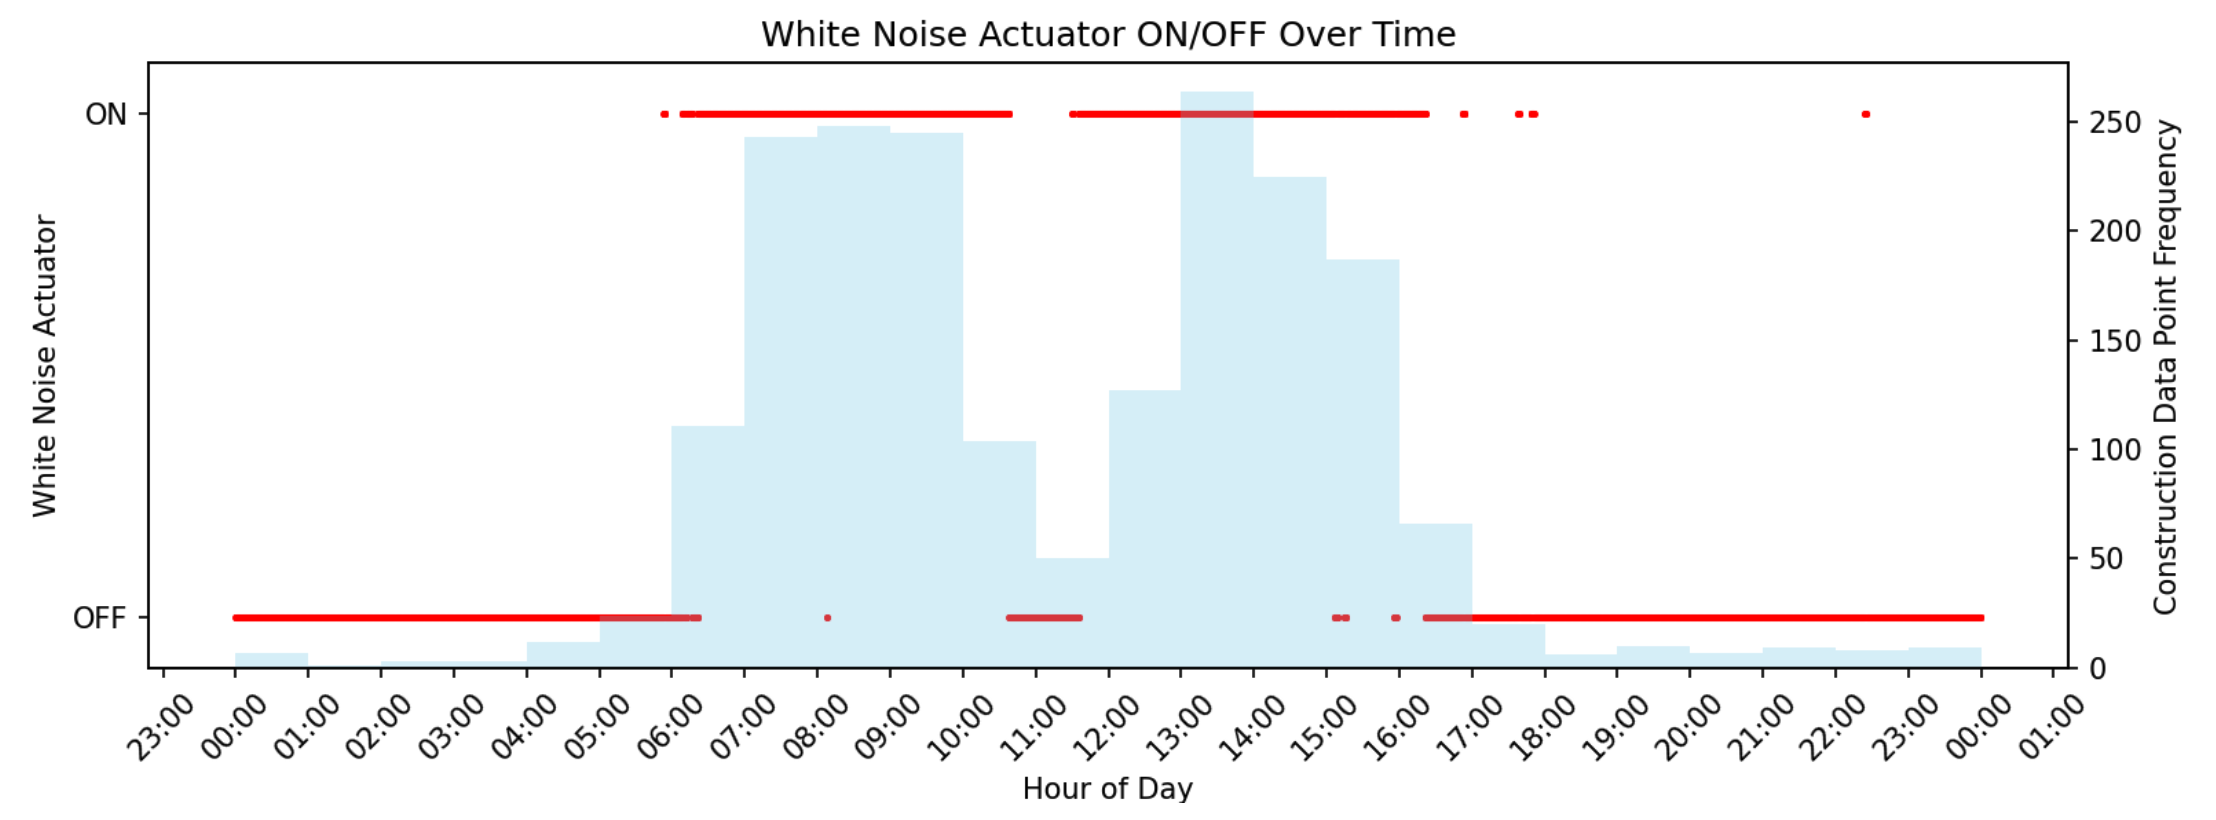
between 6:00 am and 11:00 am and 12:00 pm and 5:00 pm, consistent with standard workday patterns. To
represent the conceptual actuation of a white noise generator, a tuned exponential moving average of
model-based probabilities and hysteresis logic were implemented to generate stable ON/OFF control signals
based on model probabilities. This study presents a framework that accurately processes ambient audio,
identifying periods of high construction activity to activate a white noise masking system. The results highlight
the potential to apply this system to real-time audio sources, thereby improving the acoustic health of occupants
in developing environments.
Construction noise has become a persistent challenge for indoor work environments, particularly on busy
campuses, where working amidst constant construction has become the norm. Investigation has shown that
acoustic comfort is important to maintaining occupant health, concentration, and productivity. This study
proposes a reactive noise processing model that utilizes machine learning to classify construction noise from
recorded audio, thereby informing a conceptual white noise generator to mask and mitigate acoustic
disturbances. A 24-hour waveform audio was collected from a personal office in Olsson Hall at the University
of Virginia, with close proximity to the VERVE construction site. The audio was divided into 10-second
chunks, with 1,619 manually labeled as either 1 (not containing construction) or 0 (containing construction).
The manual data set was used to train a random forest classifier in an 80/20 train-test split, utilizing extracted
acoustic features from Librosa, a Python-based audio processing software. The model correctly labeled 82% of
audio chunks, proving the ability to identify construction noise amidst other sounds present in an academic
space. Applying the classifier to the remaining 8,646 chunks revealed that construction activity clustered
between 6:00 am and 11:00 am and 12:00 pm and 5:00 pm, consistent with standard workday patterns. To
represent the conceptual actuation of a white noise generator, a tuned exponential moving average of
model-based probabilities and hysteresis logic were implemented to generate stable ON/OFF control signals
based on model probabilities. This study presents a framework that accurately processes ambient audio,
identifying periods of high construction activity to activate a white noise masking system. The results highlight
the potential to apply this system to real-time audio sources, thereby improving the acoustic health of occupants
in developing environments.
Physics-Informed Detection of Faulty Sensors in Smart Buildings
Authors: Hunter Lutz, Shawn Thomas, Jessie Nothstine
 This paper addresses the critical challenge of sensor calibration drift in smart building
environments to help correct calibration errors which may undermine reliable building operation,
leading to inefficient HVAC control, occupant discomfort, and erroneous performance analytics.
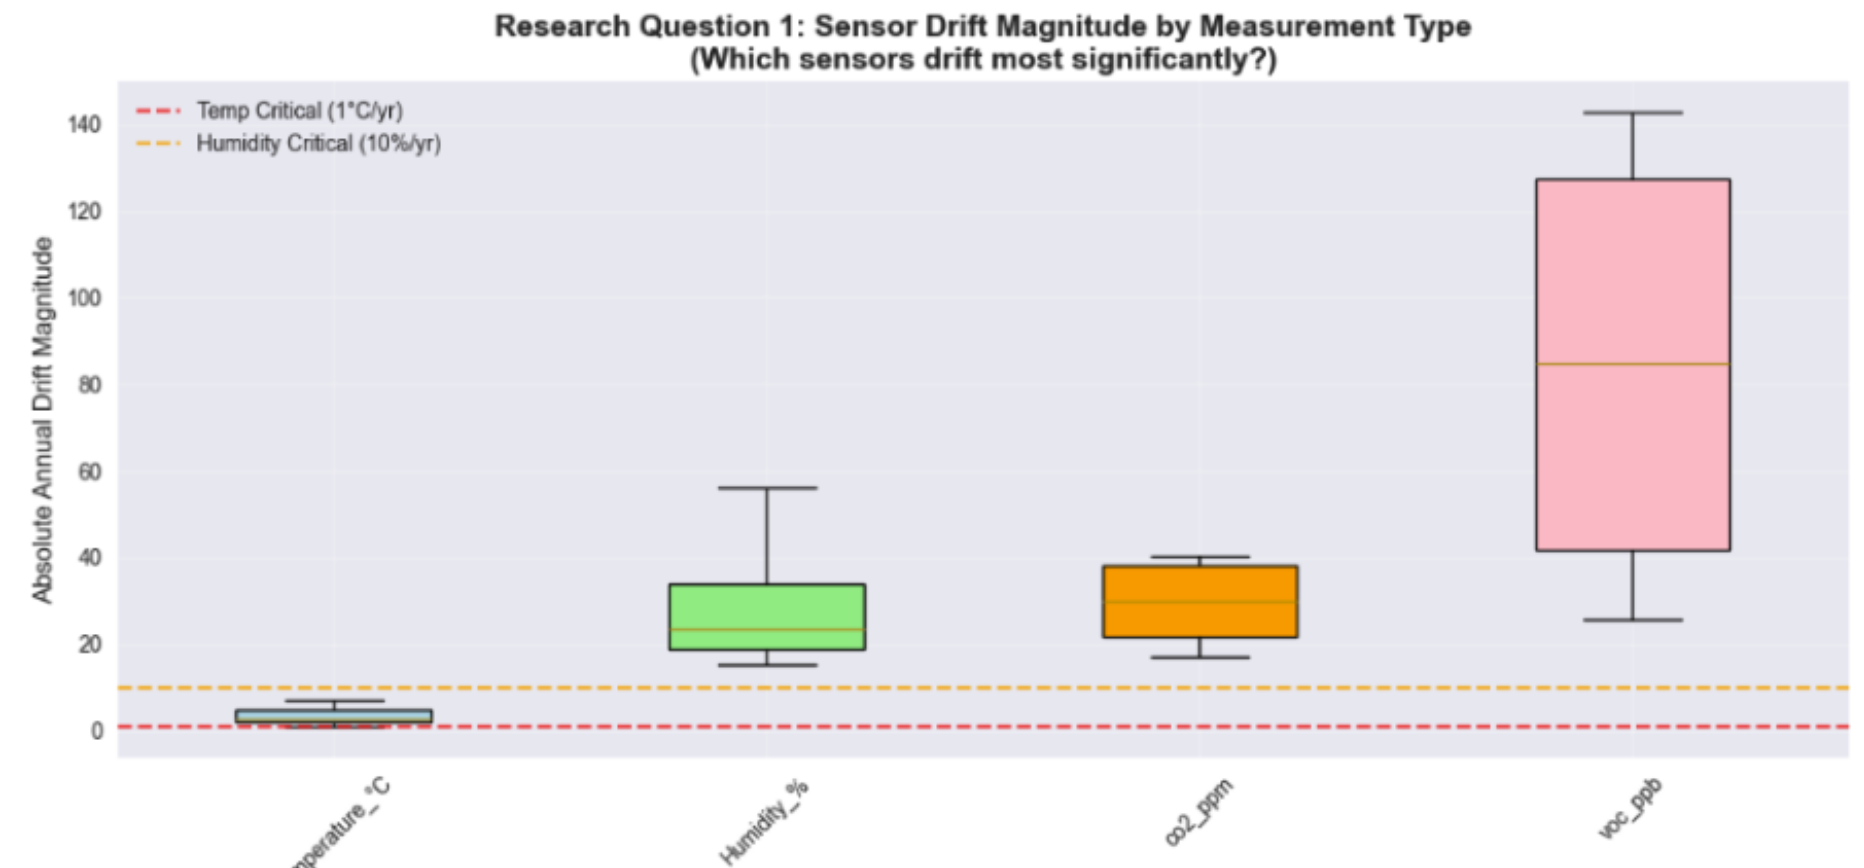
We propose a physics-informed, automated framework to detect faulty sensors using only
existing sensor data, without requiring additional hardware or manual calibration. We found that
approximately one-third of sensors exhibited significant drift, with humidity sensors proving
particularly vulnerable to miscalibration, and through field verification were able to draw
correlation between drift and exposure to environmental microclimates. Combining statistical
analysis with the discovery of potential physical constraints, we were able to reduce false
positives and enhance detection reliability.
This paper addresses the critical challenge of sensor calibration drift in smart building
environments to help correct calibration errors which may undermine reliable building operation,
leading to inefficient HVAC control, occupant discomfort, and erroneous performance analytics.
We propose a physics-informed, automated framework to detect faulty sensors using only
existing sensor data, without requiring additional hardware or manual calibration. We found that
approximately one-third of sensors exhibited significant drift, with humidity sensors proving
particularly vulnerable to miscalibration, and through field verification were able to draw
correlation between drift and exposure to environmental microclimates. Combining statistical
analysis with the discovery of potential physical constraints, we were able to reduce false
positives and enhance detection reliability.